Measles (Rubeola) Data
2019 Measles Health Advisory
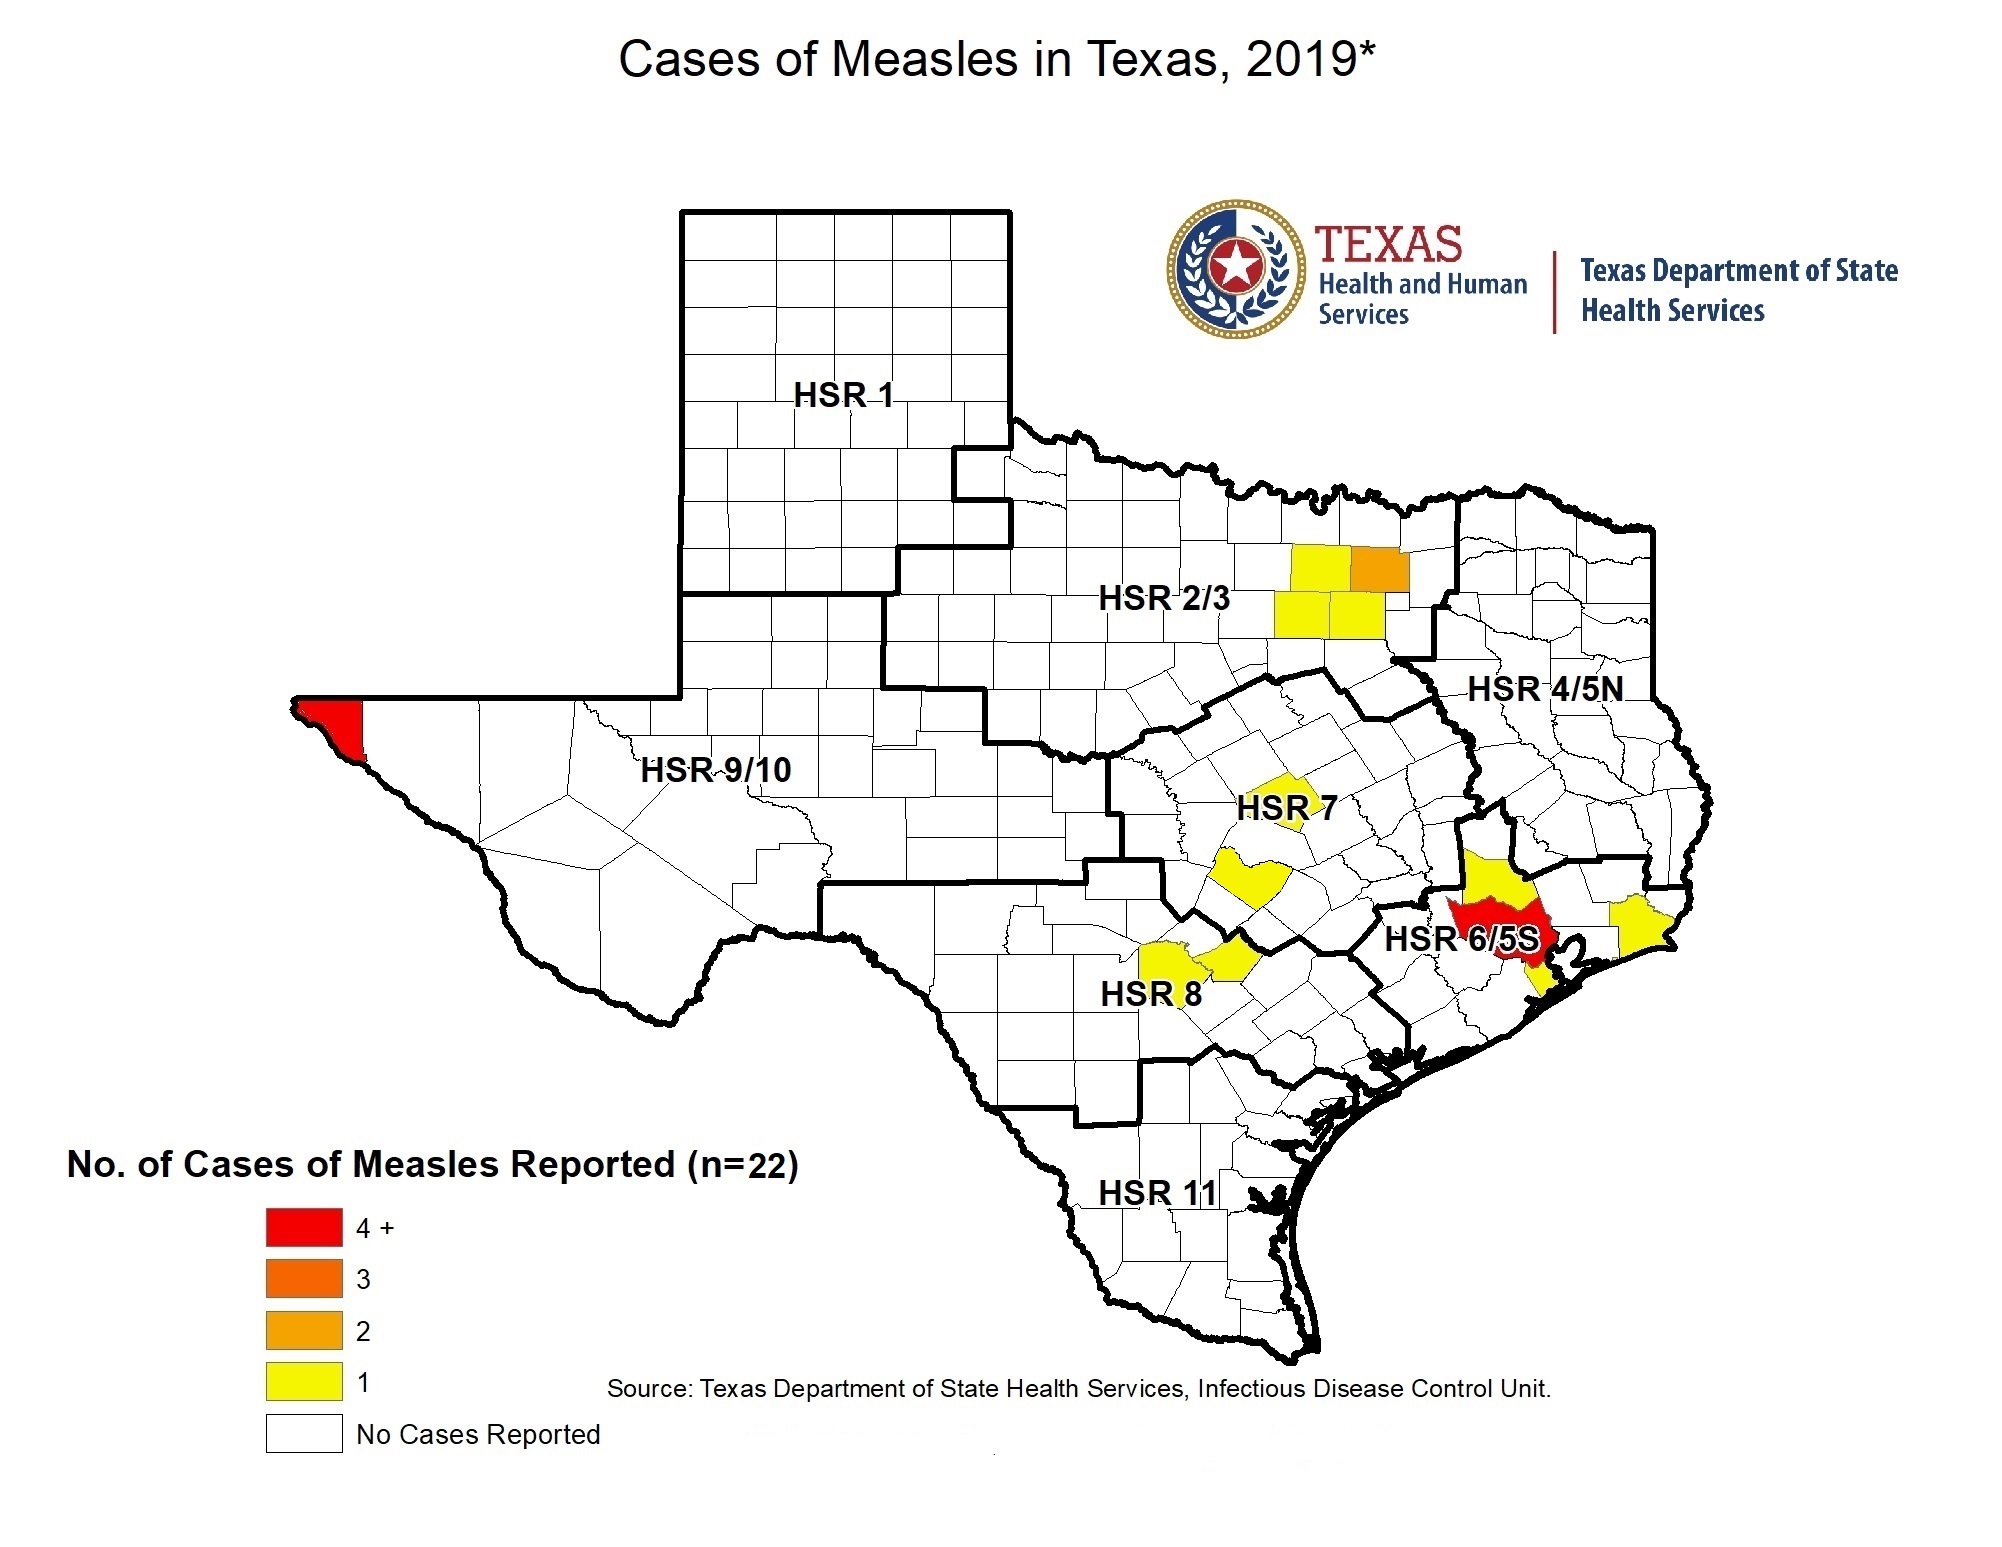
Texas has seen an increase of measles cases in 2019. Texas has twenty-two (22) confirmed cases of measles in twelve (12) counties: four counties (5 cases) in PHR 2/3, four counties (7 cases) in PHR 6/5S, two counties (2 cases) in PHR 7, two counties (2 cases) in PHR 8, and one county (6 cases) in PHR 9/10 as of 1/22/2020.
Measles Cases in Texas
| Disease | Type | 2012 | 2013 | 2014 | 2015 | 2016 | 2017 | 2018b | 2019b | 2020b | 2021b |
|---|---|---|---|---|---|---|---|---|---|---|---|
| Measles (Rubeola) | Cases | 0 | 27 | 10 | 1 | 1 | 1 | 9 | 23 | 0 | 0 |
| Incidence Rate | 0 | 0.1 | 0.04 | 0 | 0 | 0 | - | 0.1 | 0 | 0 | |
| aIncidence rates (IR) are calculated per 100,000 population. Estimated population used for 2006-2008 and projected used for 2009-2017. Population data are projected population from Texas Demographic Center’s Texas Populations Projections Program; 2021, 2020 and 2019 population projections were updated March 2022, and 2018 and earlier population projections were from the prior version. | |||||||||||
| bFor 2018-2021, per the Emerging and Acute Infectious Disease Unit Data Suppression Policy, case counts are not published when underlying populations are less than 2,000, when n <10 for populations 2,000 to 20,000, or when n<5 for populations 20,000 to 400,000. Rates are not provided when underlying populations are less than 2,000 or the Relative Standard Error exceeds 25% (n<16). | |||||||||||
| Data Source: Texas NEDSS Finalized Data File, 2012-2021, Texas Notifiable Conditions. | |||||||||||
Measles Cases and Incidence Rates in Texas by Age Group, 2018-2019 (PDF)
Measles Cases and Incidence Rates in Texas by Age Group, 2006-2017 (PDF)
Measles (Rubeola) Cases and Incidence Ratesa in Texas by Age Group, 2012-2017
| Age Group | 2012 | 2013 | 2014 | 2015 | 2016 | 2017 | ||||||
|---|---|---|---|---|---|---|---|---|---|---|---|---|
| Years | Cases | IR | Cases | IR | Cases | IR | Cases | IR | Cases | IR | Cases | IR |
| < 1 | 0 | 0.0 | 2 | 0.5 | 1 | 0.2 | 0 | 0.0 | 0 | 0.0 | 1 | 0.2 |
| 1-4 | 0 | 0.0 | 7 | 0.4 | 4 | 0.2 | 0 | 0.0 | 0 | 0.0 | 0 | 0.0 |
| 5-9 | 0 | 0.0 | 4 | 0.2 | 0 | 0.0 | 0 | 0.0 | 0 | 0.1 | 0 | 0.0 |
| 10-14 | 0 | 0.0 | 3 | 0.2 | 0 | 0.0 | 0 | 0.0 | 0 | 0.0 | 0 | 0.0 |
| 15-19 | 0 | 0.0 | 2 | 0.1 | 0 | 0.0 | 0 | 0.0 | 0 | 0.0 | 0 | 0.0 |
| 20-29 | 0 | 0.0 | 4 | 0.1 | 1 | 0.0 | 1 | 0.0 | 0 | 0.0 | 0 | 0.0 |
| 30-39 | 0 | 0.0 | 0 | 0.0 | 3 | 0.1 | 0 | 0.0 | 0 | 0.0 | 0 | 0.0 |
| 40-49 | 0 | 0.0 | 5 | 0.1 | 1 | 0.0 | 0 | 0.0 | 0 | 0.0 | 0 | 0.0 |
| 50-59 | 0 | 0.0 | 0 | 0.0 | 0 | 0.0 | 0 | 0.0 | 0 | 0.0 | 0 | 0.0 |
| 60+ | 0 | 0.0 | 0 | 0.0 | 0 | 0.0 | 0 | 0.0 | 0 | 0.0 | 0 | 0.0 |
| Unknown | 0 | - | 0 | - | 0 | - | 0 | - | 0 | - | 0 | - |
| aIncidence rates (IR) are calculated per 100,000 population. Projected population used for 2009-2017. | ||||||||||||
| Age Group | 2009 | 2010 | 2011 | |||
|---|---|---|---|---|---|---|
| Years | Cases | IR | Cases | IR | Cases | IR |
| < 1 | 0 | 0.0 | 0 | 0.0 | 2 | 0.5 |
| 1-4 | 2 | 0.1 | 1 | 0.0 | 1 | 0.1 |
| 5-9 | 3 | 0.2 | 2 | 0.1 | 0 | 0.0 |
| 10-14 | 4 | 0.2 | 6 | 0.4 | 0 | 0.0 |
| 15-19 | 11 | 0.6 | 11 | 0.6 | 0 | 0.0 |
| 20-29 | 25 | 0.7 | 26 | 0.7 | 0 | 0.0 |
| 30-39 | 24 | 0.7 | 22 | 0.6 | 2 | 0.1 |
| 40-49 | 17 | 0.5 | 16 | 0.4 | 1 | 0.0 |
| 50-59 | 14 | 0.5 | 15 | 0.5 | 0 | 0.0 |
| 60+ | 39 | 1.0 | 39 | 1.0 | 0 | 0.0 |
| Unknown | 0 | - | 0 | - | 0 | - |
| aIncidence rates (IR) are calculated per 100,000 population. Projected population used for 2009-2017. | ||||||
Measles Cases and Incidence Rates by Most Populous Counties in Texas, 2018-2019 (PDF)
Measles Cases and Incidence Rates by County in Texas, 2006-2017 (PDF)
| Vaccination Status | Number of Cases |
|---|---|
| 0 doses | 3 |
| 1 dose | 7 |
| 2 doses | 2 |
| 2 or more doses | 2 |
| Vaccinated, unknown number of doses | 2 |
| Unknown status | 7 |
| Other documented evidence of immunity | 0 |
| Total | 23 |
| *Doses refers to doses of measles-containing vaccine received. | |
For more data regarding this condition, view our Infectious Disease Annual Reports or submit a Data Request.