Fungal Meningitis Data
Home FAQs Investigation Meningitis Home Reporting Resources
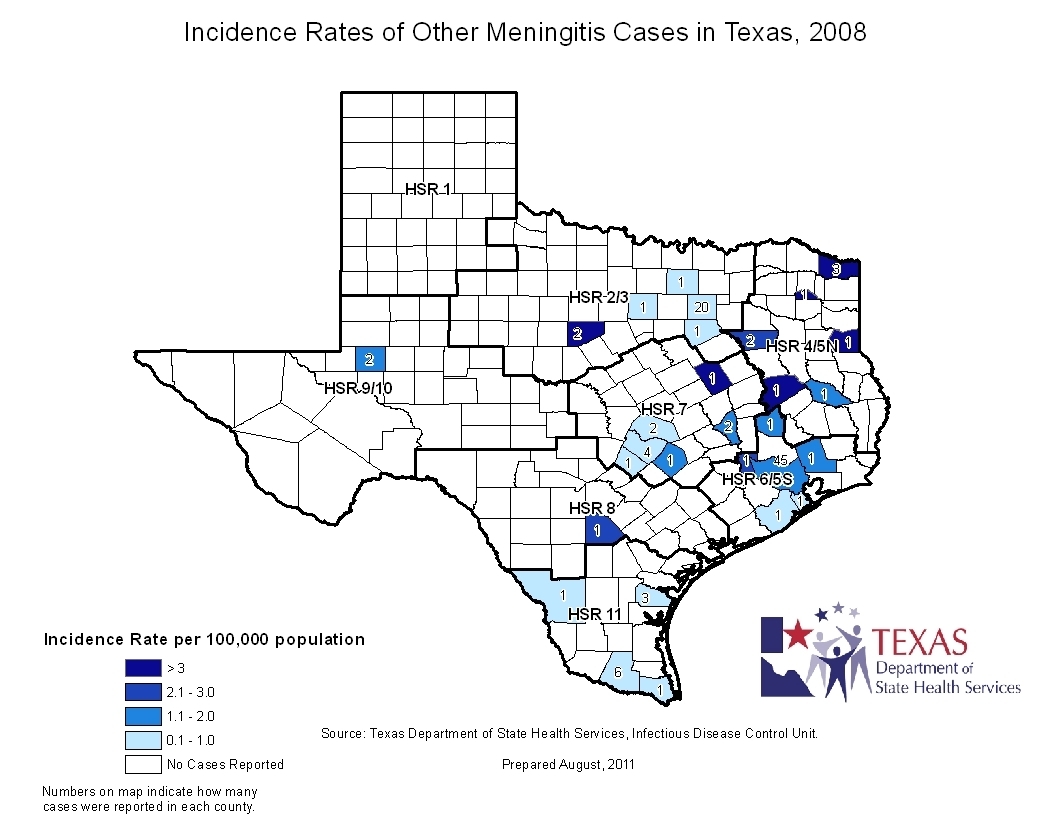
Fungal Meningitis Incidence Rate Maps: (jpg image)
2012, 2011, 2010, 2009, 2008
| Year | Year | IR |
|---|---|---|
| *2012 | 70 | 0.3 |
| 2011 | 70 | 0.3 |
| 2010 | 80 | 0.3 |
| 2009 | 92 | 0.4 |
| 2008 | 109 | 0.4 |
| 2007 | 101 | 0.4 |
| 2006 | 66 | 0.3 |
| 2005 | 68 | 0.3 |
| 2004 | 49 | 0.2 |
| 2003 | 56 | 0.3 |
| 2002 | 44 | 0.2 |
**Other meningitis includes meningitis cases caused by fungal, parasitic, or amebic organisms and excludes bacterial and viral meningitis cases. *2012 incidence rates are based on projected census data obtained from the DSHS Center for Health Statistics, Incidence rate (IR) per 100,000.
Other Meningitis Cases IR by County 2007-2012 (PDF)
| 2007 | 2008 | 2009 | 2010 | 2011 | *2012 | |||||||
|---|---|---|---|---|---|---|---|---|---|---|---|---|
| Age (Years) | Case Count | IR | Case Count | IR | Case Count | IR | Case Count | IR | Case Count | IR | Case Count | IR |
| <1 | 0 | 0.0 | 2 | 0.5 | 0 | 0.0 | 0 | 0.0 | 0 | 0.0 | 1 | 0.2 |
| 01-04 | 1 | 0.1 | 0 | 0.0 | 0 | 0.0 | 0 | 0.0 | 1 | 0.1 | 0 | 0.0 |
| 05-09 | 0 | 0.0 | 0 | 0.0 | 0 | 0.0 | 0 | 0.0 | 0 | 0.0 | 0 | 0.0 |
| 10-14 | 1 | 0.1 | 0 | 0.0 | 0 | 0.0 | 0 | 0.0 | 0 | 0.0 | 0 | 0.0 |
| 15-19 | 0 | 0.0 | 1 | 0.1 | 1 | 0.1 | 0 | 0.0 | 4 | 0.2 | 0 | 0.0 |
| 20-29 | 18 | 0.5 | 12 | 0.3 | 11 | 0.3 | 12 | 0.3 | 5 | 0.1 | 2 | 0.1 |
| 30-39 | 28 | 0.8 | 30 | 0.8 | 21 | 0.6 | 23 | 0.7 | 21 | 0.5 | 14 | 0.3 |
| 40-49 | 31 | 0.9 | 35 | 1.0 | 29 | 0.8 | 19 | 0.5 | 25 | 0.7 | 25 | 0.7 |
| 50-59 | 14 | 0.5 | 16 | 0.6 | 18 | 0.6 | 14 | 0.5 | 13 | 0.4 | 15 | 0.5 |
| 60+ | 8 | 0.2 | 13 | 0.4 | 12 | 0.4 | 12 | 0.3 | 12 | 0.3 | 13 | 0.3 |
| Unknown | 0 | 0.0 | 0 | 0.0 | 0 | 0.0 | 0 | 0.0 | 0 | 0.0 | 0 | 0.0 |
| Total | 101 | 0.4 | 109 | 0.4 | 92 | 0.4 | 80 | 0.3 | 81 | 0.3 | 70 | 0.3 |
**Other meningitis includes meningitis cases caused by fungal, parasitic, or amebic organisms and excludes bacterial and viral meningitis cases.
*2012 incidence rates are based on projected census data obtained from the DSHS Center for Health Statistics. Incidence rate (IR) per 100,000. Incidence rate per 100,000.