2011-2012 Texas Influenza Surveillance Activity
Texas Influenza Summary Report, 2012–2013 Season
(September 30, 2012 – September 28, 2013)
Texas Influenza Summary Report, 2012-2013 in PDF Format
Reports from the 2011-12 season.
Overview
The 2012–2013 influenza season was classified as “moderately severe” in the US1. During the 2012–13 influenza season, Texas and US ILINet data indicated that the peak percentage of visits due to ILI and the number of weeks above the ILI baseline were much higher compared to the 2011–2012 season1,2. US data indicated that hospitalization rates in persons of all ages were higher compared to the 2011–12 season; there were also almost five times as many influenza-associated pediatric deaths reported in the US compared to the previous season. Although influenza A (H3N2) viruses predominated in the US and Texas, influenza B viruses were also detected frequently.
Viral Surveillance
National Respiratory and Enteric Virus Surveillance System (NREVSS)[i]
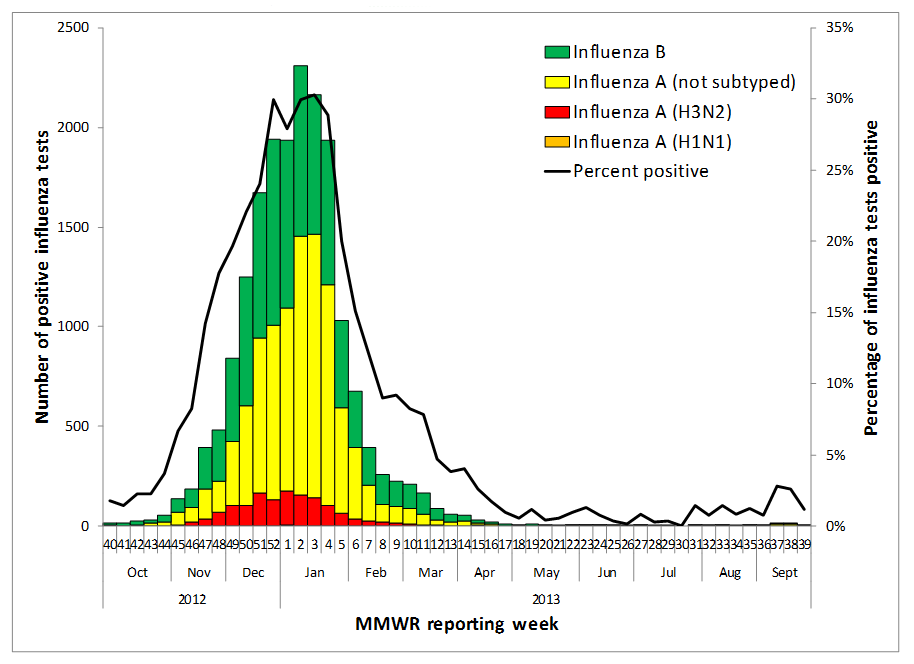
During the 2012–13 season, 27 participating laboratories in most Texas Health Service Regions (HSRs) submitted data to NREVSS on antigen detection, virus isolation (i.e., culture), and polymerase chain reaction (PCR) testing for influenza. Of the 108,985 influenza tests that were reported to NREVSS from Texas laboratories, 18,709 (17.2%) were positive for influenza virus. Of the 18,709 positive tests, 10,509 (56.2%) tests were positive for influenza A and 8,200 (43.8%) tests were positive for influenza B. The majority (86.3%) of the positive test results for influenza A reported through NREVSS were reported as influenza A (not subtyped) because most laboratories in Texas do not perform subtyping or perform mostly antigen detection tests (which do not provide a subtype result). Of the 1,439 influenza A results for which subtyping was reported, 2.8% were identified as influenza A (H1N1) and 97.2% were identified as influenza A (H3N2). The peak of influenza activity reported by Texas NREVSS laboratories occurred during the week ending January 19, 2013 (MMWR week 3), when 30.3% of tests were positive for an influenza virus (Figure 1).
Figure 1. Influenza types and subtypes reported by National Respiratory and Enteric Virus Surveillance System laboratories in Texas, 2012–13 season
Texas Public Health Laboratories[ii]
The first PCR positive influenza specimens of the season were collected from patients in HSR 11 during the week ending October 6, 2012 (MMWR week 40) and were identified as influenza B by the DSHS Austin Lab (Figure 2). Influenza viruses were detected every week from the beginning of October through mid-May (MMWR week 40 through week 18), and then sporadically thereafter. The first positive specimens for influenza A (H3N2) and influenza A (H1N1) were confirmed in mid-October. All three virus types and subtypes circulated throughout the remainder of the season; however, influenza A (H3N2) was the predominant subtype of influenza A that was detected during the 2012–13 season in Texas.
Figure 2. Influenza types and subtypes identified by Texas public health laboratories, 2012–13 season
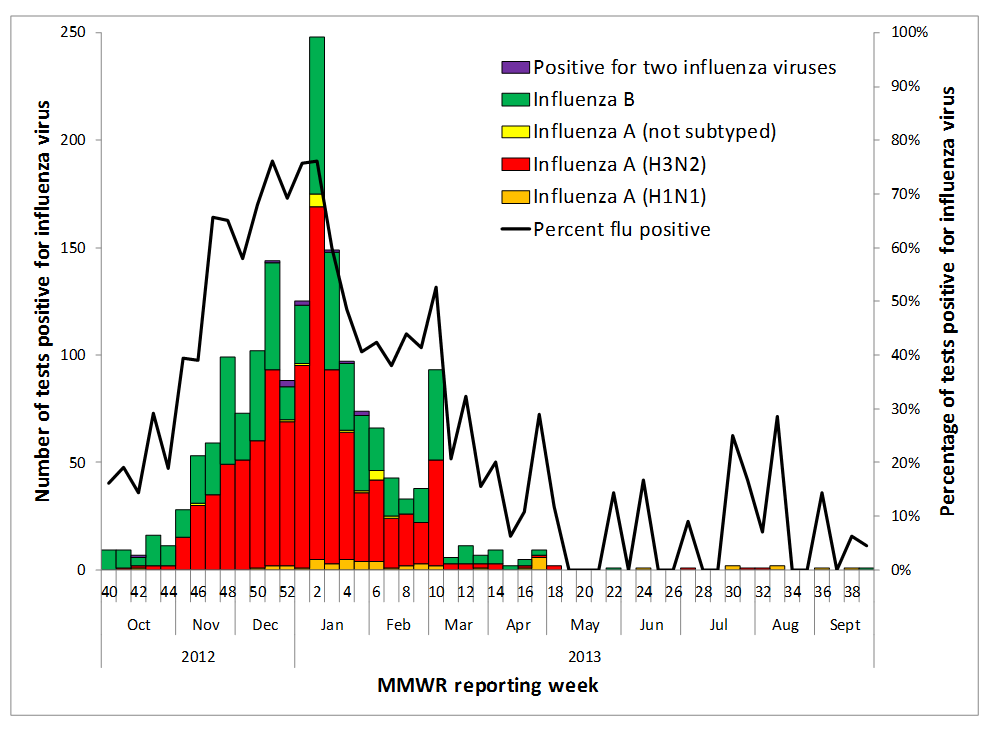
Specimen submission began to increase during the week ending November 10, 2012 (week 45). The peak percentage of specimens positive for influenza, 76.2%, occurred during the week ending December 22, 2012 (week 51). The proportion of specimens positive for influenza virus in the 2012–13 season equaled or exceeded 10% for 27 consecutive weeks. Specimen submission began to decline sharply beginning in the week ending March 16, 2013 (week 11).
Over the course of the 2012–13 influenza season, Texas public health laboratories received 3,568 specimens for influenza surveillance that met specimen testing and handling requirements; of those, 1,727 (48.4%) were positive for influenza virus. Of those that were positive for influenza virus, 1,080 (62.54%) were identified as influenza A viruses, 636 (36.83%) were identified as influenza B viruses, and 11 (0.64%) were positive for multiple influenza viruses (e.g., influenza A (H1N1) and influenza A (H3N2), influenza A (H3N2) and influenza B, etc.). Of the 1,064 influenza A positives that were subtyped, 51 (4.8%) were identified as influenza A (H1N1) and 1,013 (95.2%) were identified as influenza A (H3N2).
Antigenic Characterization of DSHS Austin Laboratory Influenza Positives[iii]
One hundred twenty-six influenza viruses from Texas were submitted for antigenic characterization during the 2012–13 season: 19 influenza A (H1N1) viruses, 65 influenza A (H3N2) viruses, and 42 influenza B viruses.
All 19 of the influenza A (H1N1) viruses were characterized as A/California/07/2009 (H1N1)-like, the 2012–13 Northern Hemisphere vaccine influenza A (H1N1) component. Sixty-four of the influenza A (H3N2) viruses were characterized as A/Victoria/361/2011 (H3N2)-like, the 2012–13 Northern Hemisphere influenza A (H3N2) vaccine component; influenza virus was not detected in the remaining A (H3N2) specimen submitted by the DSHS Lab.
Of the 42 influenza B viruses characterized, 36 (85.7%) were characterized as B/Wisconsin/01/2010-like (part of the B/Yamagata lineage), the 2012–13 Northern Hemisphere vaccine influenza B component. Six (14.3%) viruses were characterized as similar to B/Brisbane/60/2008 (a B/Victoria lineage virus). Both lineages were detected during the winter of 2012 through the spring of 2013. Antigenic characterization results from Texas specimens were similar to those reported by the Centers for Disease Control and Prevention (CDC) during the 2012–13 season in the United States1.
Antiviral Resistance Testing of DSHS Austin Laboratory Influenza Positives
During the 2012–13 season, 125 influenza isolates were tested by CDC for resistance to commonly prescribed influenza antiviral medications (Table 1). One influenza A (H3N2) virus was resistant to oseltamivir. All other tested viruses from Texas were sensitive to oseltamivir and zanamivir.
| Oseltamivir Virus samples tested (n) |
Oseltamivir Resistant viruses, number (%) |
Zanamivir Virus samples tested (n) |
Zanamivir Resistant viruses, number (%) |
|
|---|---|---|---|---|
| 2009 influenza A (H1N1) | 12 | 0 (0%) | 12 | 0 (0%) |
| Influenza A (H3N2) | 65 | 1 (1.5%) | 65 | 0 (0%) |
| Influenza B | 48 | 0 (0%) | 48 | 0 (0%) |
Morbidity Surveillance
US Outpatient Influenza-like Illness Surveillance Network (ILINet)[iv]
One hundred forty providers in Texas submitted data to ILINet for at least one week during the 2012–13 season (i.e., 2012 MMWR week 40 to 2013 week 39) (Figure 3). During the official influenza reporting season (i.e., 2012 week 40 to 2013 week 20), an average of 60 providers submitted data on an average of 26,343 patient visits each week.
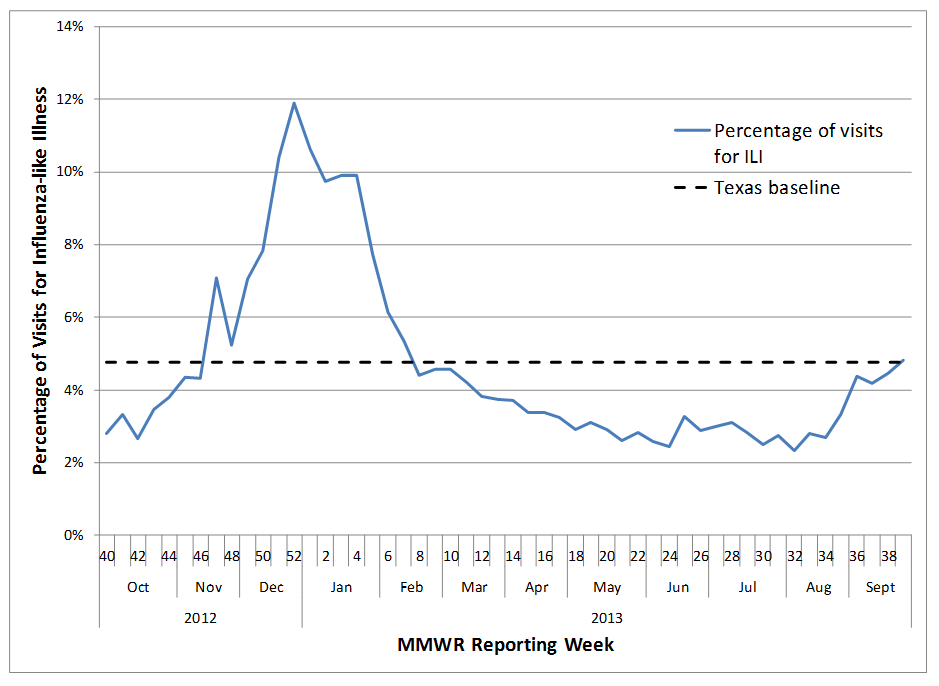
The Texas ILI baseline for the 2012–13 season was 4.77%.[v] According to data from Texas ILINet participants, the percentage of visits due to ILI first exceeded the Texas baseline during the week ending November 24, 2012 (MMWR week 47), with 7.07% of visits due to ILI (Figure 4). Influenza-like illness peaked during the week ending December 29, 2012 (week 52). During that week, ILINet providers reported that influenza-like illness accounted for 11.91% of all patient visits. The percentage of visits due to ILI fell below the state baseline in the week ending February 22, 2013 (week 8). The percentage of visits due to ILI continued to decrease and remained below the state baseline for the remainder of the season, except during the week ending September 29, 2013 (week 39).
Overall, ILI activity in Texas exceeded the Texas baseline for 13 consecutive weeks and one week at the end of the season. The peak percentage of visits due to ILI reported in Texas ILINet for the 2012–13 season was the highest peak reported since the 2009 pandemic. The peak occurred several weeks earlier than the peaks in the previous two seasons.
Figure 3. Number of active Texas participants per county in the US Outpatient Influenza-like Illness Surveillance Network, 2012–13 influenza season [vi]
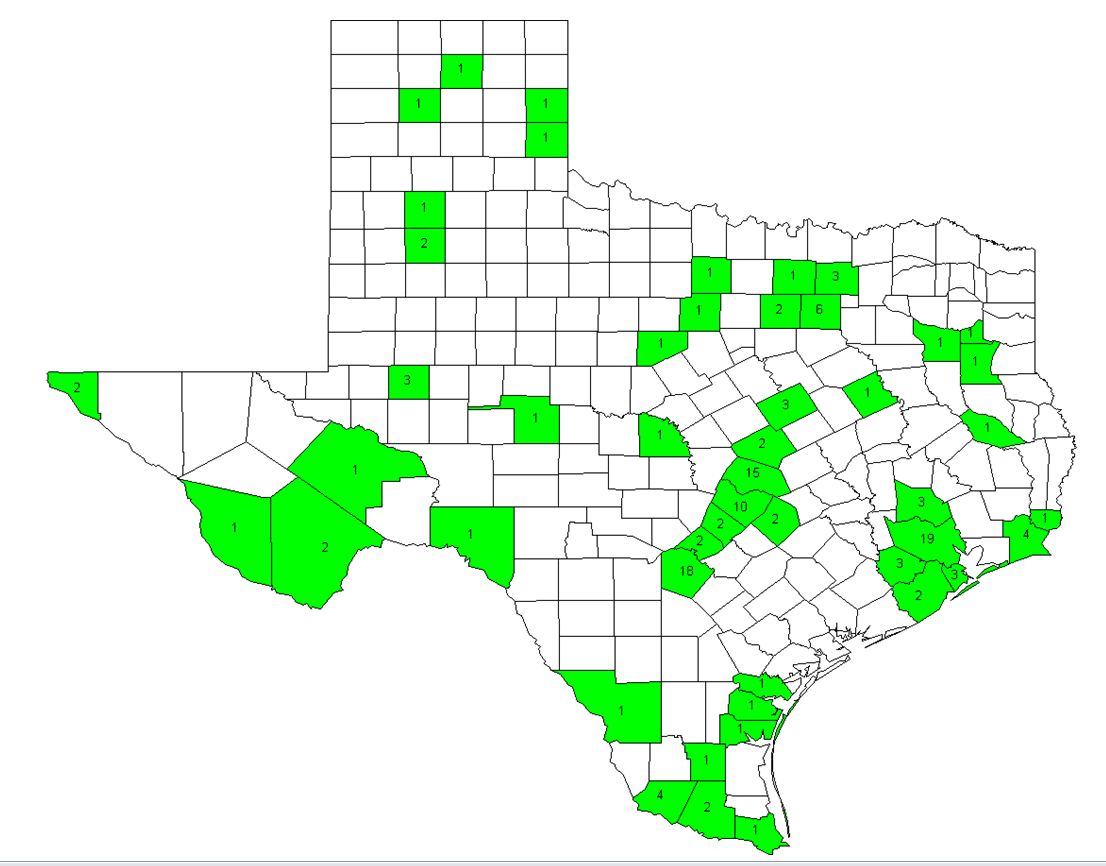
Figure 4. Percentage of visits for influenza-like illness reported by the US Outpatient Influenza-like Illness Surveillance Network in Texas, 2012–13 season
Influenza Incidence Surveillance Project (IISP)[vii]
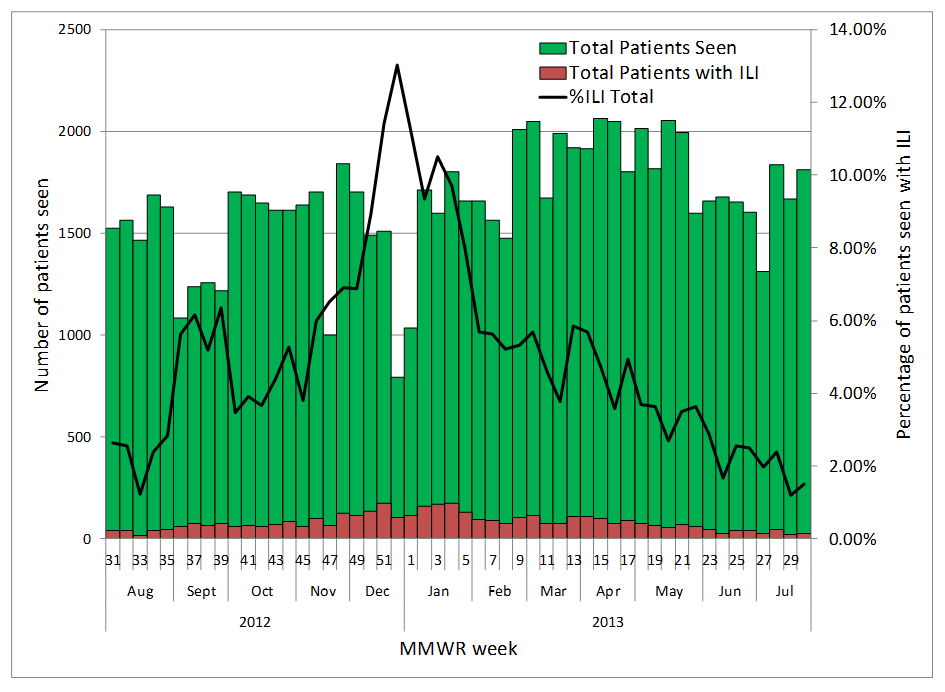
From July 29, 2012 through July 27, 2013, seven Texas providers reported a total of 85,231 patient visits for any reason and 4,148 patient visits for influenza-like illness (ILI), or 4.87% of visits for ILI during the project period. Over the entire project period, the percentage of visits for ILI was highest at 15.37% for 1-year-old children. The percentage of visits for ILI was lowest for adults aged 65 years and older at 0.94%. During influenza surveillance season, the estimated incidence of ILI in outpatient healthcare populations peaked at 560.08 per 100,000 population during the week ending December 22, 2012 (week 51). The percentage of visits for ILI peaked at 13.02% in the week ending December 29, 2012 (MMWR week 52) (Figure 5).
A total of 390 ILI specimens were submitted for testing during the project period, and 370 (94.9%) of those were acceptable for testing. Overall, 225 (60.8%) ILI specimens tested for the IISP project were positive for at least one respiratory virus and 38.6% of all specimens tested were positive for an influenza virus (includes single and mixed infections). Results are displayed in Table 2.
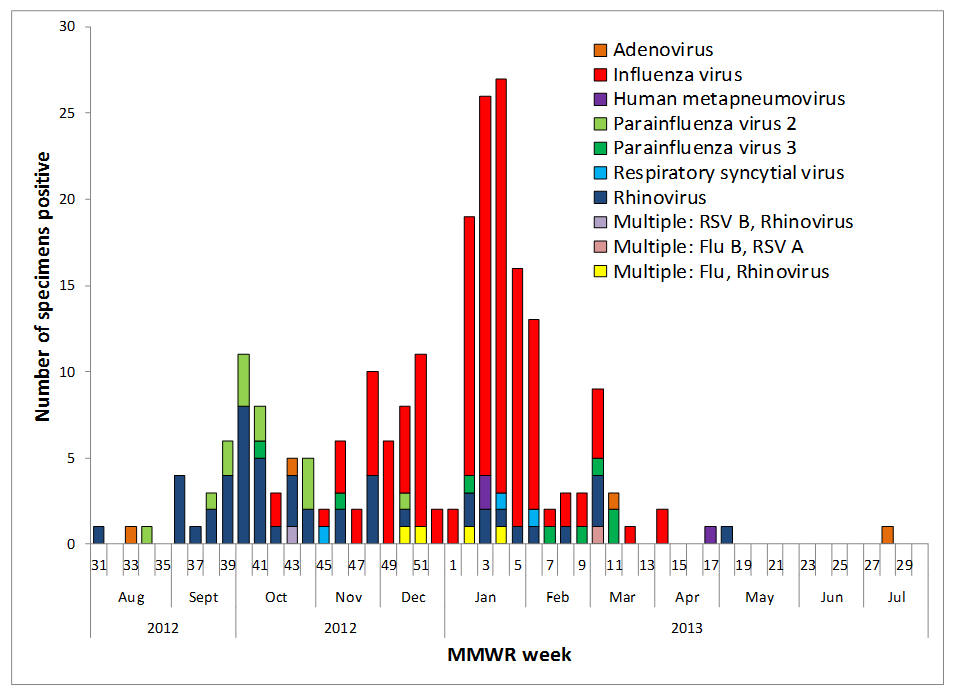
Providers began submitting specimens for IISP in August 2012. Rhinoviruses and parainfluenza viruses were the main respiratory viruses detected from September and October 2012 (Figure 6). Influenza viruses, parainfluenza viruses 2 and 3, and rhinoviruses were the predominant viruses detected from November 2012 through March 2013; respiratory syncytial viruses, human metapneumoviruses, and adenoviruses were detected sporadically during this timeframe. Very few patient specimens were submitted from April 2013 through July 2013 even though during these weeks participating providers were still seeing patients with ILI (weekly median ILI patients seen by all providers combined: 55 ILI patients; range: 20 to 109 ILI patients per week).
Figure 5. Percentage of visits for influenza-like illness reported by providers in the Influenza Incidence Surveillance Project, Texas, 2012–13 season
| Viruses detected | Number of specimens positive | Percentage of total specimens positive |
|---|---|---|
| Positive for one or more respiratory viruses | 225 | 60.81% |
| Influenza virus (all types/subtypes) | 136 | 60.44% |
| Influenza A (H1N1) | 3 | 2.21% |
| Influenza A (H3N2) | 72 | 52.94% |
| Influenza B | 61 | 44.85% |
| Adenovirus | 4 | 1.78% |
| Human metapneumovirus (HMPV) | 3 | 1.33% |
| Parainfluenza virus 2 | 13 | 5.78% |
| Parainfluenza virus 3 | 8 | 3.56% |
| Respiratory syncytial viruses (RSV) | 3 | 1.33% |
| RSV A | 1 | 1.33% |
| RSV B | 2 | 66.67% |
| Rhinovirus | 50 | 22.22% |
| Multiple viruses detected | 8 | 3.56% |
| Influenza A (H3N2) and 2009 influenza A (H1N1) | 1 | 12.50% |
| Influenza A (H3N2) and influenza B | 1 | 12.50% |
| Influenza A (H3N2) and rhinovirus | 1 | 12.50% |
| Influenza B and rhinovirus | 3 | 37.50% |
| Influenza B and RSV A | 1 | 37.50% |
| Rhinovirus and RSV B | 1 | 12.50% |
| Negative or inconclusive | 145 | 39.19% |
| Total tested | 370 | 100.00% |
Figure 6. Respiratory viruses detected through the Influenza Incidence Surveillance Project (IISP), Texas, 2012–13
School Closures and Institutional Outbreaks
Five ILI, influenza, or other respiratory virus outbreaks were reported in schools and daycares during the 2012–13 season. Outbreaks were reported from HSRs 2/3, 6/5S, and 7. The four reported school outbreaks occurred from October through January and were attributed to influenza-like illness (ILI) with undetermined etiology (2 schools), influenza A (H3N2) (1 school), and influenza B (1 school). One outbreak of parainfluenza virus 1 was reported in a daycare during September 2013.
Twenty institutional outbreaks of ILI, influenza, or other respiratory viruses were reported during the 2012–13 season. Outbreaks were reported from HSRs 2/3, 4/5N, 6/5S, 7, and 8. Sixteen long-term care facility (LTCF) outbreaks were reported from November 2012 through March 2013. All of the LTCF outbreaks were caused by influenza (7 influenza A [not subtyped], 7 influenza A [H3N2], 2 influenza B). Two outbreaks were reported in correctional facilities in January and July 2013. The pathogens identified in these outbreaks included influenza A (H3N2), influenza A (H1N1), and rhinovirus. Two outbreaks of influenza-like illness were also reported in hospitals during November 2012 and January 2013.
Mortality Surveillance
Influenza-Associated Pediatric Mortality[viii]
Twenty influenza-associated pediatric fatalities were reported to DSHS during the 2012–13 influenza season. Besides the pandemic season, this is the highest number of influenza-associated pediatric deaths reported to DSHS for a single influenza season since reporting for this condition began in Texas in 2007.
The reported deaths occurred during the week ending November 17, 2012 (MMWR week 46) through the week ending April 27, 2013 (week 17); one death occurred during the week ending September 28, 2013 (week 39). These deaths were reported in residents of all Texas HSRs except HSRs 1 and 4/5N. Six (30%) patients had confirmed influenza A infections, 11 (55%) patients had influenza B infections, and 3 (15%) patients had co-infections of influenza A and B. Subtyping of the influenza A virus was performed for three of the influenza A infections and for one co-infection; all of these viruses were identified as influenza A (H3N2).
The median age at death was 9 years with patients ranging in age from 2 months to 17 years. Of the twenty reported cases, three cases were younger than 6 months of age, three cases were 6 months to 4 years of age, seven cases were 5 to 10 years of age, and seven cases were 11 to 17 years of age. Of the 14 cases who were eligible for vaccination and for whom influenza vaccination status was known, two (14%) were vaccinated for the current season. Sixteen (80%) cases had significant underlying medical conditions and/or a bacterial or viral co-infection.
Texas Influenza Surveillance System
Background
Influenza and influenza-like illnesses (ILI) were last reportable by law in any county in Texas in 19936. During that year, over 275,000 cases of influenza and influenza-like illness were reported to the Texas Department of State Health Services (DSHS) (legacy agency Texas Department of Health). The only influenza categories reportable by law in Texas for the 2012–13 season included influenza-associated pediatric fatalities, outbreaks associated with influenza, and novel influenza A infections in humans. Because there is no current reporting requirement for the majority of influenza illnesses, it is not known how many influenza-related illnesses, hospitalizations, and deaths occur each year in Texas residents. A small number of influenza cases are reported voluntarily through sentinel surveillance networks composed of laboratories, hospitals, physicians, nurses, schools, and universities located throughout the state. Additional resources include web-based influenza and ILI reporting systems, as well as local and regional health departments that gather data from surveillance participants in their jurisdictions. Data from all sources are reported to the DSHS Central Office in Austin, compiled, and presented weekly in the Texas Influenza Surveillance Report.
Components
The national influenza reporting period begins in early October [Morbidity and Mortality Weekly Report (MMWR) week 40] and continues through late May (MMWR week 20). Influenza surveillance in Texas continues year-round, although in reduced capacity during the summer months. The goals of influenza surveillance are to determine when and where influenza viruses are circulating, if the circulating viruses match the vaccine strains, what changes are occurring in the viruses, what impact influenza is having on hospitalizations and deaths, and the severity of influenza activity. The three main Texas influenza surveillance components are viral, morbidity, and mortality surveillance. Viral influenza surveillance at the state level consists of influenza test results reported by Texas laboratories in the National Respiratory and Enteric Virus Surveillance System (NREVSS) and specimens sent to public health laboratories for influenza surveillance testing. Morbidity surveillance consists of reports of novel influenza A virus infections in humans; reports of ILI from Texas participants in the US Outpatient Influenza-like Illness Surveillance Network (ILINet), the Enhanced ILINet/Influenza Incidence Surveillance Project (IISP), and local and regional health department surveillance; and reports of influenza or ILI outbreaks. Mortality surveillance includes influenza-associated deaths in children younger than 18 years of age.
References
- Centers for Disease Control and Prevention. FluView: 2012-2013 Influenza Season Surveillance Summary. Available at http://www.cdc.gov/flu/weekly/pastreports.htm. Accessed on January 30, 2014.
- Centers for Disease Control and Prevention. FluView: Influenza Surveillance Summary: 2011-2012 Influenza Season. Available at http://www.cdc.gov/flu/weekly/pastreports.htm. Accessed on January 30, 2014.
- Centers for Disease Control and Prevention. U.S. Outpatient Influenza-like Illness Surveillance Network: 2012–13 Workfolder. 55.20E, Rev. 06/2012.
- Council of State and Territorial Epidemiologists. Influenza Incidence Surveillance Project – Application. April 1, 2011.
- Centers for Disease Control and Prevention. Influenza-Associated Pediatric Mortality, 2004 case definition. Available at: http://wwwn.cdc.gov/NNDSS/script/casedef.aspx?CondYrID=729&DatePub=1/1/2004%2012:00:00%20AM. Accessed on February 6, 2013.
- Texas Department of Health. Epidemiology in Texas 1993 Annual Report. Available at: http://www.dshs.state.tx.us/idcu/data/documents/1993%20Texas%20Annual%20Report.pdf.
[i] NREVSS is an online laboratory results reporting system for several respiratory and enteric viruses that is maintained by the CDC. NREVSS reporters in Texas are primarily hospital laboratories, although two public health laboratories (Tarrant County Public Health [Laboratory Response Network] Lab and the DSHS Austin Laboratory) also participate. See http://www.cdc.gov/surveillance/nrevss/ for more information.
[ii] Influenza surveillance specimens are submitted for PCR testing to the DSHS Austin laboratory, the Houston Department of Health and Human Services Laboratory, and the Texas Laboratory Response Network (LRN) laboratories throughout the season by physicians, hospitals, clinics, and health departments across Texas. The Texas LRN laboratories have been participating in influenza surveillance since the 2008–2009 influenza season; the participating LRN laboratories are located in Corpus Christi, Dallas, El Paso, Fort Worth, Harlingen, Houston, Lubbock, San Antonio, and Tyler.
[iii] Like other state virology laboratories in the country, DSHS submits early, mid, and late-season as well as unusual influenza viruses to the CDC for strain characterization. Specimens and influenza viruses are also submitted at regular intervals according to CDC’s instructions.
[iv] Texas participants in ILINet report weekly on the number of patient visits for ILI by age group and the total number of patients seen for any reason. For ILINet reporting, ILI is defined as “fever (≥100°F [37.8°C], oral or equivalent) and cough and/or sore throat in the absence of a known cause other than influenza”3. ILINet data are used to calculate a weekly percentage of visits due to ILI.
[v] The baseline is the mean percentage of patient visits for ILI during non-influenza weeks for the previous three seasons plus two standard deviations. A “non-influenza week” is defined as a week that accounted for less than 2% of the season’s total number of specimens that tested positive for influenza.
[vi] In order to be considered an active participant in ILINet, a provider must report at least one week during the season. Therefore, active providers did not necessarily report every week of the influenza reporting season.
[vii] IISP is a collaborative project among CDC, the Council of State and Territorial Epidemiologists (CSTE), and state and local health departments to “[monitor] the age-specific incidence of medically-attended ILI and influenza-associated ILI in real time throughout the influenza season”4. Providers submit weekly data on the number of patients with ILI by age group and the total patients seen by age group. Specimens collected from the first 10 ILI patients seen each week by each participating provider are tested for the presence of influenza and other respiratory viruses (adenovirus, rhinovirus, respiratory syncytial virus, human metapneumovirus, and parainfluenza virus). Texas participated in IISP for the first time during the 2011–12 season.
[viii] “An influenza-associated death is defined for surveillance purposes as a death resulting from a clinically compatible illness that was confirmed to be influenza by an appropriate laboratory or rapid diagnostic test. There should be no period of complete recovery between the illness and death. Influenza-associated deaths in all persons aged <18 years should be reported”5.
2012-2013 Texas Influenza Surveillance Information - Flu Reports
For the week ending:
10/06/12, 10/13/12, 10/20/12, 10/27/12, 11/03/12, 11/10/12, 11/17/12, 11/24/12, 12/01/12, 12/08/12, 12/15/12, 12/22/12, 12/29/12, 01/5/13, 01/12/13, 01/19/13, 01/26/13, 02/07/13, 02/14/13, 02/21/13, 02/28/13, 03/02/13, 03/09/13, 03/16/13, 03/23/13, 03/27/13, 04/6/13, 04/13/13, 04/20/13, 04/27/13, 05/4/13, 05/11/13, 05/18/13, 05/25/13, 06/1/13, 06/08/13, 06/15/13, 06/22/13, 06/29/13, 07/6/13, 07/13/13, 07/20/13, 07/27/13, 08/03/13, 08/10/13, 08/17/13, 08/24/13, 08/31/13, 09/07/13, 09/14/13, 09/21/13, 09/28/13